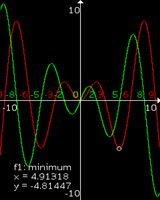
 This application makes it possible to use your mobile phone as a graphical calculator. You can plot multiple mathematical functions, calculate the critical points, show the derivate, find the solutions of an equation, show a function table...
Features:
You can enter any mathematical function you want to plot and evaluate
You can zoom in/out and move the canvas infinitely
The solutions of an equation can be calculated and shown
Easy function input with the insert function command (list of commands).
The first derivate can be shown
You can calculate the local minima and maxima of the function
The second derivate can be shown
You can calculate the function inflection points
Multiple functions can be plotted in different colors at once
The intersection points of the different equations are calculated and can be shown
You can interactively evaluate the functions at their critical points
You can show a function table with the function coordinates at it's critical points
(So the nullpoints, minima, maxima, inflection points... are automatically calculated)
Build-in samples thow the possibilities and possible functions
Calculate any function point up to 15 decimals.
In the settings you can set the internal precision, so you can choose between low precision (fast) or high precision (slow), depending on the speed of your mobile. These settings are saved, so you don't have to reset it each time.
You can save your equations and add them to the samples library of the Graph Viewer. These samples are saved persistent, for as long as you want.
Built-in Functions
* sqrt(f): square root of function f
* e^(f): number of euler power f
* f! : the faculty of function f
* sin(f): sinus of function f (in radians)
* cos(f): cosinus of function f (in radians)
* tan(f): tangens of function f (in radians)
* rad(f): converts function f from degrees to radians
(e.g.: use "sin(rad(90))" to calculate the sinus of 90 degrees)
* deg(f): converts function f from radians to degrees
* ln(f): the natural logarithm of function f
* log(f): the 10 base logarithm of function f
* abs(f): the absolute value of function f
* int(f): the integer value of function f
* frac(f): the fraction of function f
* rnd: random number between 0 (inclusive) and 1 (exclusive)
(you can't evaluate nor show the table of a equation using rnd)
* d(f): the derivate of function f
* e: the number e (e=2.718281828...)
* pi: the number pi (pi=3.1415926536...)
where f can be any combination of functions
Key Bindings
While viewing the graph
* 2 or UP: move up
* 8 or DOWN: move down
* 4 or LEFT: move left
* 6 or RIGHT move right
* 1, 3, 7, 9: move diagonally
* 5: zoom in
* 0: zoom out
* #: horizontally zoom in
* *: horizontally zoom out
While evaluating the function
* 4 or LEFT: previous critical point
* 6 or RIGHT: next critical point
* 1 or 7: move left
* 3 or 9: move right
* 2 or UP: move up
* 8 or DOWN: move down
* 5: zoom in
* 0: zoom out
* #: horizontally zoom in
* *: horizontally zoom out
Tidak ada komentar:
Posting Komentar